 |
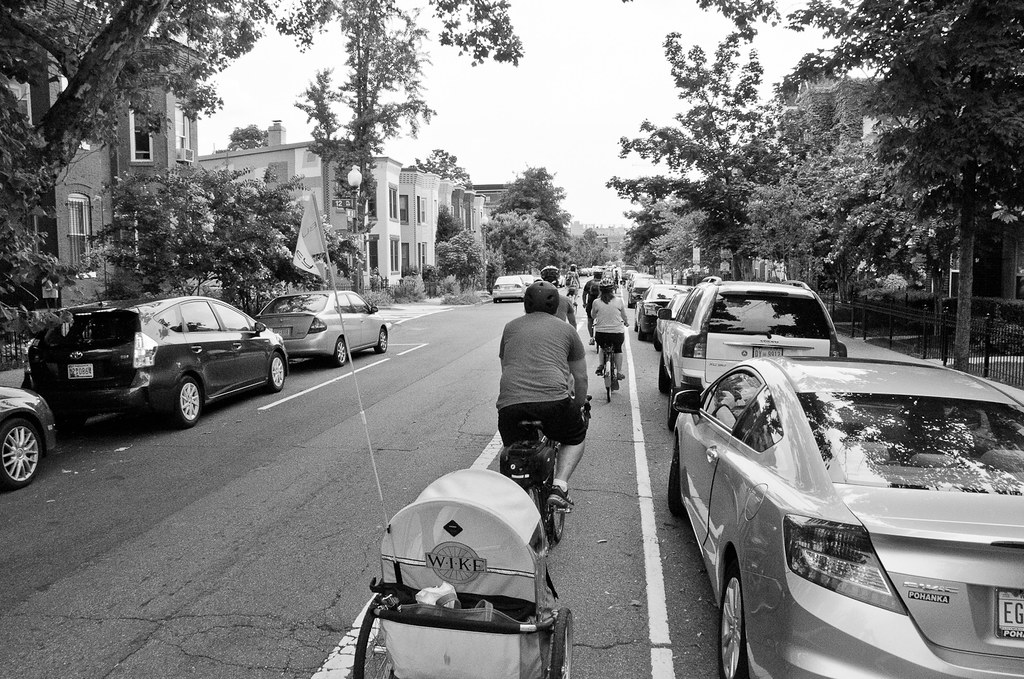
| The District ranks 5th among the 2017's Best Destinations to Explore by Bike Image: Author |
While most studies like this are more or less based on the feelings of the author, this one uses good a methodology that the District could use to evaluate its progress at the ward or community level.
The District's Rank
The site compared 53 of the largest cities in the country and using 13 metrics across four categories to determine a full ranking of the most bike-friendly cities.
The District was ranked 5th with a score of 91.8, just edging out the former bicycling infrastructure leader, Portland which had a score of 90.6, and miles behind 4th place New York and Chicago, tied with a score of 93.3. The site notes that one of the main reasons for the District high rank is its Capital BikeShare program, one of the nation's largest. The District also tied for first when it comes to safety as it averages 1.6 fatalities per 10,000 bike commuters annually.
Where the District struggles is with its bike infrastructure, where it is ranked 28 out of 53 other cities. This suggests that the year-over-year additions to bike facilies as well as the number of bike lanes is lower than the top 4 cities. Also, although BikeShare is expanding rapidly across the District with 463 bikes per 10,000 commuters in its fleet, the methodology dings us as it compares the number of actual bikes and the number of stations per capita equally.
A Thorough Methodology
Reward Expert used a fairly comprehensive methodology to create its ranking score using U.S. cities with more than 300,000 residents. As mentioned, the site grouped 'Bikeability' using four overall metrics or dimensions:
1) City Profile
2) Bike Safety
3) Biking Infrastructure
4) Bike-Share Programs
They identified 13 metrics or indicators in respective dimensions, weighting them accordingly. Each metric was given a value between 0 and 100, with 100 representing the most favorable conditions for travel and zero the least. Finally, they calculated the overall score for each city using the weighted average across all metrics and ranked the cities accordingly. The metrics are as follows:
City Profile - 20 Points
- Bikeability: Full Weight (5.0%)
- Number of Pleasant Days Per Year: Half Weight (2.5%)
- Percent of Commuters who Bike: Half Weight (2.5%)
- Annualized Change of Commuters Who Bike To Work: Double Weight (10.0%)
Biking Infrastructure - 40 Points
- Miles of Protected Bike Lanes: Weight 10.0%
- Miles of Unprotected Bike Lanes: Weight 5.0%
- Miles of Paved Biking Paths: Full Weight 3.0%
- Miles of Bike Lanes per Square Mile: Weight 2.0%
- Annualized Change of Bike Lanes per Square Mile: Weight 20.0%
Biking Share Index - 25 Points
- Number of Bikes in Program Fleet per capita: Full Weight (12.5%)
- Number of Bike Stations per capita: Full Weight (12.5%)
Biking Safety - 15 Points
- Pedestrian/Biker fatalities per 10,000 commuters: Weight 5.0%
- Annualized Change of pedestrian/Biker Fatalities per 10,000 commuters: Weight 10.0%
One of the shortcomings of the District Department of Transportation (DDOT) with regard to the installation of bicycling facilities is that they do not appear to use - or at least share with the public - a methodology to determine an area's needs. While they do occasionally share study information, those studies tends to focus on overall road throughput or safety instead of the strengths or weaknesses of a community's bike facilities.
Another problem is that DDOT has added bike infrastructure where they could do so easily, not necessarily because it was needed. While there are advantages to this approach, the lack of any quantitative ranking mechanism makes it easier for some to reject projects that could be highly beneficial or providing more bike facilities to communities that are already great for bicycling.
By measuring District Wards or communities using score or a methodology similar to the Reward Expert study, DDOT could rank areas and bike needs so that all road users could understand how their areas stack up. Also, it would provide residents some idea of the bike inventory and why they should or should not receive additional bicycle facilities. Funds could then be redirected toward outreach and other resources of traditionally undeserved communities.
The entire list of the top 53 cities, as well as the article, can be found here.
Casino no deposit bonus codes | DRMCD
ReplyDeleteCasino no deposit bonus codes · 대전광역 출장샵 No 의정부 출장마사지 Deposit 남양주 출장마사지 Bonuses · Free Spins, no deposit bonus codes 전주 출장마사지 · Exclusive 평택 출장마사지 Cashback Bonuses · Play With Real Money.