 |
| Image: Author |
Bike mode share continues to increase in the District, even as other cities seen slower growth or a reduction bike use. With over 16,000 commuter bicyclists, the District is a national leader in bike mode share. While there are a number of factors that contribute to the District's status, it appears that women bicyclists - among other groups - are helping drive the city's success, according to data from the Census.
As reported by Streetsblog and the D.C. Bicycle Advisory Council, the League of American Bicyclists looked at 2016 Census Bureau data on how Americans commute, specifically how they commute by bike. Called the American Community Survey (ACS), it is a nationwide survey designed to show communities how they are changing over time. The ACS collects information on age, race, income, home value, veteran status, and other important data.
The League complied this data and produced a comprehensive report called Where We Ride: An Analysis of Bicycling in American Cities. The yearly report measures the growth or decline of bicycling in across the 70 largest U.S. cities; the cities with the most commutes by bike; and ranks bike usages in each state, the District, and Puerto Rico. While the League focuses on national statistics, Bike Specific will show some of the District's statistics from the League report, the ACS, and other sources.
The Data
The ACS examines data as reported by survey participants, so naturally it excludes those who simply were not contacted or who failed to complete the survey. Also, the survey source specifically collects information on work trips, not recreational or other bike usage. Lastly, the ACS states statistical margins of error up to +/- 2.5 percent, depending on the specific question.The figures below are derived from ACS and League data. According to the League, there are two limitations to the data. The survey only measures those who “usually” get to work in the “last week” before the question was asked, and it only captures the mode used for the most distance. These limitations mean that occasional bike commuters and multi-modal commuters who use bikes are unlikely to be captured.
A subset of the ACS, the Commuting Characteristics By Sex data set is the source of most mode share information and identifies changes in how people get to and from work by their most common transportation modes. The mode shares identified are personal motorized vehicles (cars, trucks, vans), public transportation, walking, bicycling, car sharing or other means (taxicab, motorcycle, etc.), or working at home. Also, the ACS data aggregates data nationally, at the state, county, and city levels. Information can also be sorted at the zip code level, which could be useful at a later point.
Unfortunately, the Commuting Characteristics by Sex data set doesn't correlate income, race, or other factors captured in other data sets, which would be help given the District's diversity. For this post, let's focus only on the Commuting Characteristics by Sex data and information collected by the league.
National Trends
Since 1990, bicycle commuting has seen steady growth; however, that growth has slowed or retreated. The total number of U.S. bike commuters fell slightly in 2016, for the second year in a row, to 863,979. While the overall number seems impressive, that translates into a national commuting mode share of only 0.57 percent. Streetsblog suggests that the gas price spike between 2008-2014 helped fuel the some of the mode shift to bicycling and as those prices have leveled off, some recent converts have shifted back to cars or some other commuting mode.The figure above, which is complied from the League's analysis, shows the bicycling commuter mode share nationally and for the 70 largest cities from 1990 through 2016. From 1990 to 2000, bike commuting saw stagnent growth. Since 2000, and with a few exceptions, overall bike use grew annually until 2014 for states and cities. From the height of the automotive fuel costs in 2014 until 2016; however, bike commuter mode share has decreases approximately 8.1 percent at the state level and 12.2 percent in the 70 largest cities where it plateaued in 2013 and has fallen each year since.
Share of Bike Commuters
Unlike many cities, the District has seen continued growth in commutes by bike, making it one of the top U.S. cities. Several factors contribute to this including that three out of four District residents work in the District, according to the survey. If you compared the District as a state, it would by far have the highest bicycle mode share in the nation. Since 1990, bike use has increased approximately 506 percent and in 2000, only about 3,000 respondents stated that they commuted by bike.The figure above shows the top 10 largest cities with the highest bike mode share for 2016. The data shows that the District ranks second only to Portland, Oregon with the highest share of bicycle commuters at 4.6 percent. Portland may take the top spot with an impressive 6.3 percent bike commuter mode share, but its recent growth is anemic. From 2011 to 2016, Portland's bike mode share grew only 1.0 percent, while the District grew at 46.0 percent. From 2015 to 2016, Portland experienced a 9.6 percent drop in bike commuting. Conversely, the District experienced a bike mode share increase of 12.1 percent during the same period.
Women and Bicycling
While there are many factors that contribute to the District's bicycling status including topography, income, and bike infrastructure improvements, new women bicyclists may be the prime contributor to the growth of bicycling in the District according to the ACS.Recently created organizations like Black Women Bike DC and the Washington Area Bicyclists Association's Women & Bicycles program have provided a forum for women to talk about bicycling and help them develop the confidence to do so safely. Before that in 1999, cycling groups like Artemis Racing were helping women reach their bicycling goals. There no coincidence that their work has contributed to the growth of women bicyclists as well as the overall growth of bicycling in the District.
The ACS Commuting Characteristics by Sex data set reveals that 3.8 percent of women report that they commuted to work by bike in 2016. To put this increase in perspective, in 2006 total bike commuter mode share was at 2.0 percent; with only 1.1 percent of women reporting that they commute by bike. Both men and women have seen an increase in mode share since. Between 2006 to 2016, bike commuting saw a 86.2 percent increase among men. However during the same period, the District saw dramatic growth in women commuting by bike, a 245.5 percent increase.
The survey sugguests that women are moving away from cars and transit and considering bikes or other transportation modes for their commutes. The figure above shows the change in commuting mode share for women in the District, comparing the change from 2015 to 2016 (blue) and from 2010 to 2016 (red). Women who commuted by bicycle increased 21.1 percent between 2015 ad 2016. Since 2010, car use in the District has experienced a 7.0 percent commuter mode share decrease while transit has seen a decrease 8.4 percent. Since 2010, more women are using taxicabs, motorcycles or car share options like Lyft and Uber to commute to work, growing by 35.7 percent. The expansion of teleworking in the District allows more women to avoid on the roads commuting, as increasing by 23.7 percent over the last six years.
Changes in Other Commuting Modes
When comparing bike commuting with all other modes over the ten year period from 2006 to 2016, we see that the change is much more compelling.The figure above shows the overall change in mode share, comparing 2006 with 2016. By far bicycle commuting has seen the largest increase, growing by 130.0 percent during that time. The walking commuter and those who used car share or motorcycles to get to work saw increases of 16.1 and 14.3 percent, respectively. Those deciding to work from home saw a 50.0 percent mode share increase from 4.0 to 6.0 percent. As the Coalition on Smarter Growth noted, the District has the highest share of commuters who both bike and walk, a combined total of 18.3 percent.
Other Bike Commuting Statistics
The League report also notes which U.S. cities have the largest number of bicyclists. Among the nation's largest cities, New York and Chicago top the list with an estimated 48,601 and 22,449, respectively. The District ranks 6th in the nation with 16,647 bicyclists commuters. Streetsblog notes that Davis, California, one of the country’s longtime leaders in bicycle mode share, saw its third straight year of falling estimates in the ACS. An estimated 17.0 percent of trips were made by bike, down from 25.0 percent in 2013. |
| District Bike Commuter Mode Share has increased 506 percent since 1990. [ACS] |
If there is one area where the District is lacking, it's cities with the highest share of bicyclists. The District is tied 13 out of the top 20 cities of total trips made by bike. This figure ranks all cities with populations over 50,000.
Where Does the District Stand
For some, bicycling in the District may not be a year-round activity as it tends to have cold winters and hot, humid summers. Additionally, bicycling competes with at least a half-a-dozen other transportation modes including the much maligned but fairly effective WMATA, robust car-sharing, telecomuting walking, and potentially gondolas. The terrain and natural or man-made impediments may also play a role in certain areas, especially in communities east of the Anacostia River. And to be honest, bicycling isn't for everyone.The District has seen a solid and promising increase in the number of women bicycle commuters but it could be higher. FiveThrityEight asked in 2014 "Why Women Don't Cycle"? While they cite several reasons including legitimate issues like hygiene and what clothes to wear, safety was the biggest concern. The 2010 Women’s Cycling Survey found that over 73 percent of women were concerned about distracted driving. About 13 percent were concerned about sexual assault, harassment or sexism while biking, which the District discussed earlier this year. The same post cited survey results from the Bikes Belong Coalition, which found that 'women were twice as likely as men to report an “inability to carry children or other passengers” as a factor that discouraged them from cycling'.
The District's inclusion of people of color and lower income residents has been mixed. For years, these communities did not have access to affordable bikes or safe infrastructure that allowed them to safely access the city's core or its jobs. While there are plans to reconstruct infrastructure to encourage bicycling, many of the these projects will take years to complete. Even then, the District government and the bike community must work with communities to address specific needs. For example, the average cost of car ownership could be as high as $11,000 per year. By contrast, bike ownership is relatively low at a less than $400 per year.
However, the initial investment of a bike purchase could be high and bicycle maintenance is a potential deterrent as some areas of the District have no local bike shops. The introduction of Capital BikeShare and dockless bike sharing in 2017 has the potential to lower that entry costs to a few dollars per use and also eliminates maintenance costs. Connecting dockless with lower income residents could lead to substantial growth in bike mode share for both recreation and commuting.
 |
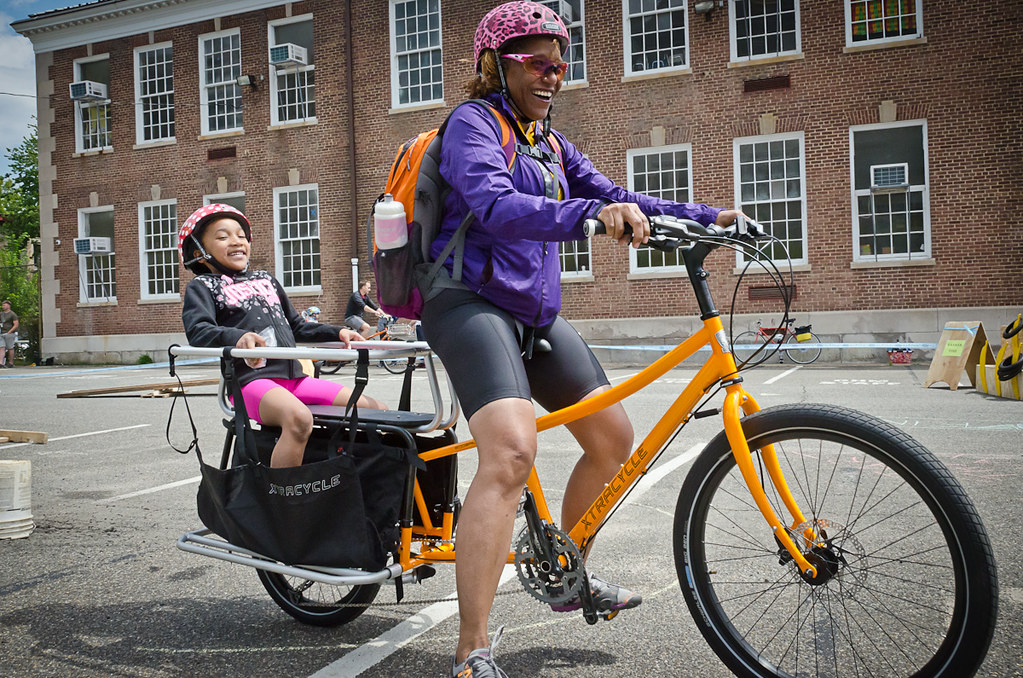
| Getting women and children on bikes is important. Image: Author |
As the data suggests however, the growth in bike commuting mode share could become stagnate or drop as it has in other cities. The District, its regional partners, and the bike community should continue to both improve and maintain the transportation network and reach out to communities and groups that were historically ignored. This means constructing safe bike parking, access to shower or changing facilities, and understanding how traditionally underserved groups see bicycling.
Working together, they can encourage the use of non-single occupancy motorized vehicles - removing cars from the road and potentially allowing more space for biking, walking, transit - and one day perhaps - gondolas and funiculars. This will potentially make bicycling safer for everyone, increasing the likelihood that more people will chose to bike to work. The ACS data seems to suggest that the key to the expansion of bicycling in the District - and nationally - is to continue to focus on women and those who haven't experienced the the joy of the bike commute.
Comments
Post a Comment
Thanks for your comment!